Afternic launches Visitor Statistics for landing pages

In 2023, Afternic focused on releasing a series of highly requested features based on feedback from domain sellers.
Along with major updates such as Lease to Own came the likes of ownership verification, expedited payouts, and the Lead Center. The latter provides domain sellers with improved visibility on inbound leads that arrive via Afternic’s landing pages. Data is always a driving force for domain sellers to make informed decisions.
Afternic’s latest release, visitor statistics, is another valuable metric for domain name sellers on the world’s leading domain name marketplace that we’re excited to share.
Introducing Visitor Statistics
For domain name sellers, the addition of visitor statistics at Afternic has been a popular ask. That popularity stems from the desire to gain vital insights into a domain portfolio.
Visitor statistics at Afternic measure how many users visit your domain name’s Afternic landing page, whether that’s Request Price, Buy Now, or our Dan.com Lander. Our Dan.com Lander, launched earlier this year, uses Afternic nameservers and provides Afternic customers with an option to display Lease to Own terms.
Visitor statistics contribute to the data points necessary to determine a domain name’s value. These data points can also play a role when it comes to deciding whether to renew a domain name or not.
Type-in traffic, displayed as visitor statistics at Afternic, can tell you how many people are typing in and visiting your domain name, either expecting to find a product or service, or looking to buy the domain name.
We are excited to now share this additional data with domain name sellers as another point of reference to help them understand their portfolios in more detail.
How to Find Visitor Statistics

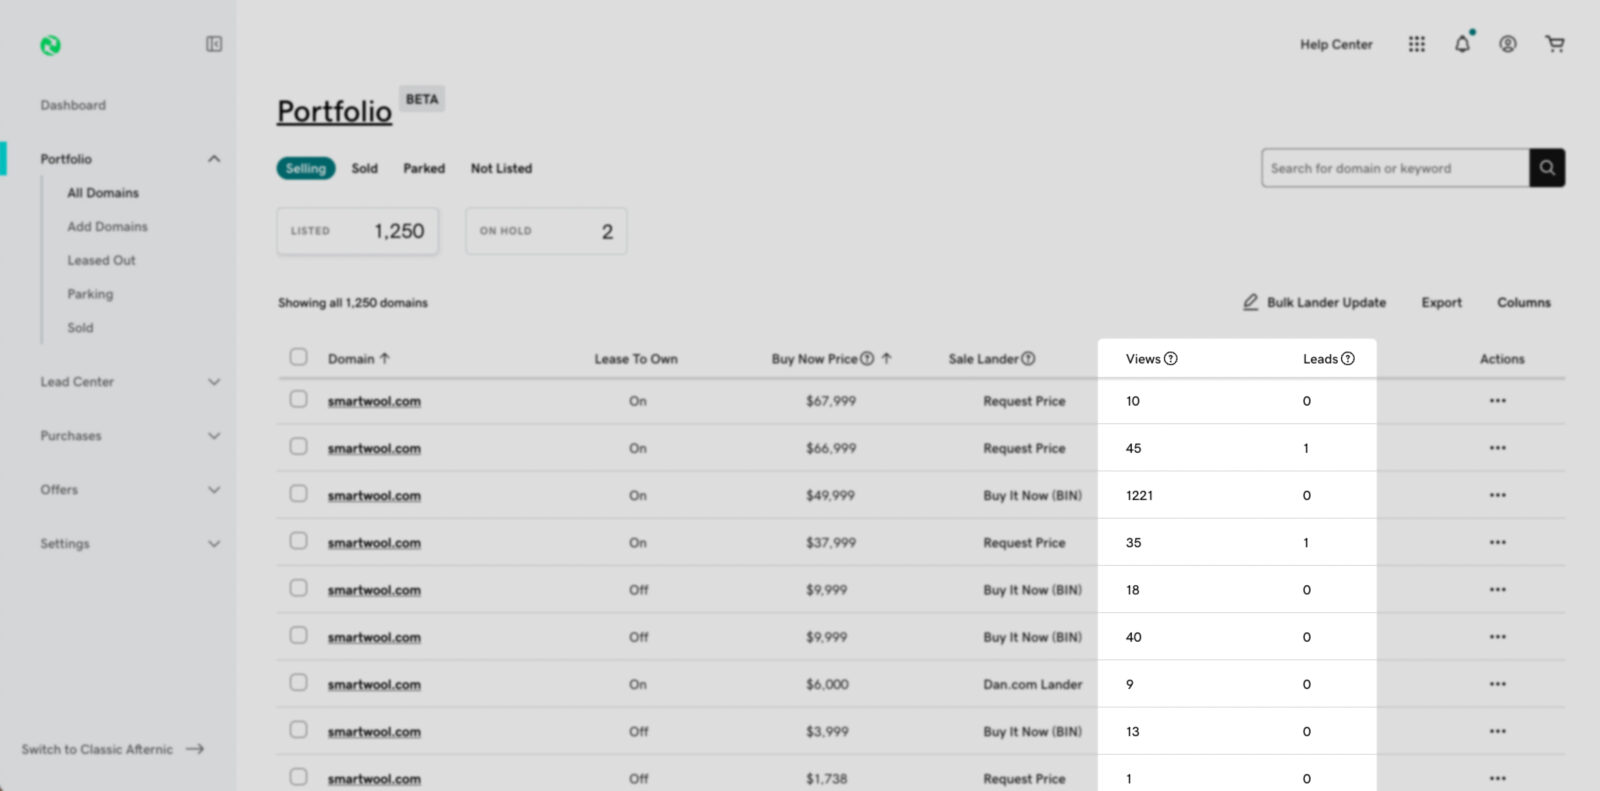
Visitor statistics are available at a glance through the new “Views” column on your Afternic portfolio page, providing you with a visitor count for each domain name from the last 30 days.
The running tally can be coupled with the other new column, Leads, which keeps track of the number of inquiries that have been submitted for your domain through the Request Price landing page over the last 30 days.
While these leads go to Afternic’s Lead Center and are trackable there, it is helpful to have this data at your fingertips on your Afternic portfolio page.
Both of these columns can be added to your portfolio page view from the ‘Columns’ button.
In-Depth Statistics

While the view count on your portfolio page gives you a glimpse of your data from the past 30 days, some domain name sellers want access to statistics going back further than that.
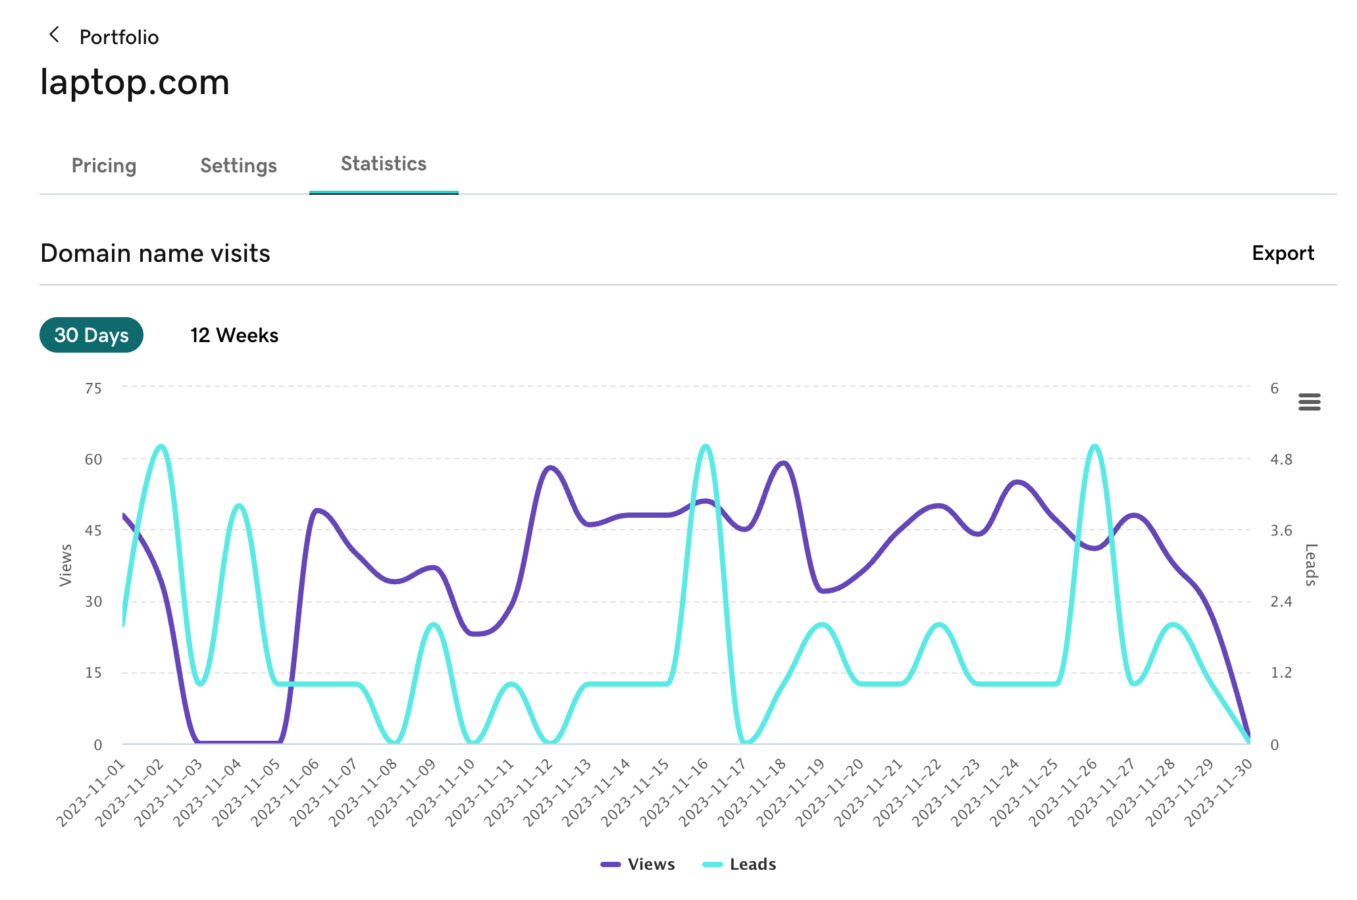
This is something that Afternic considered and built into this release. By clicking on an individual domain name from your portfolio, you’ll notice a brand new tab: Statistics.
From here, you can see a graph tracking both lander submissions and domain name views dating back further than 30 days. To begin with, our data will go back 12 weeks but this will increase as time goes on.
The interactive graph allows you to hover over individual dates to see your view count for that day, but if you want to download this data, view counts for individual domain names can be exported via CSV.
You can head to your Afternic portfolio page to take a look at your visitor count from the last 30 days for domain names using Afternic landing pages. We are confident that the new statistics will bring added insights into your domain name portfolio that you can use to become a more successful domain name investor.
Featured posts
Introducing Good as Gold Payouts: Reinvest Faster with GoDaddy
The best part of closing a domain sale? Getting paid. Afternic already…
What’s New at Afternic: Lease to Own for Custom Checkout Link, Search Insights, and More
This year has already been a year of innovation at Afternic, with…
Introducing GoDaddy Search Insights
Data-driven insights are essential in domain selling, and few data points are…
